Even in the age of big data, answers to important business questions can be elusive. For example, a major retailer can have a group of similar stores—same store size, same average income in its surrounding neighborhood, same age or gender of its average shopper—yet they are located in different places. When a new product fares better or worse in one region, the company needs to figure out why and create a strategy for improving sales.

Enter a new design for data pooling strategy based on—you guessed it—Samurai Sudoku, a popular number puzzle that has overlapping parts. Peter Qian, a professor of statistics in the UW-Madison College of Engineering, former doctoral candidate Xu Xu (Ph.D. ’14) and Qing Liu, associate professor of marketing at the Wisconsin School of Business, published a paper in The American Statistician that offers a new, innovative strategy for organizing data to answer difficult questions.
Liu recently sat down with the news team at the Wisconsin School of Business to explain what’s different about this proposed design and what its impact could be.
WSB: What’s new about this design?
QL: This builds on a common way of gathering information. There are statistical designs that ensure data samples are representative. Other designs pool or combine data from multiple sources, and that has a long history in statistics and a variety of uses. Our design has a data pooling property and has overlaps that other designs don’t have. That could help you assess the inherent differences in the different sources. These are new; these are things previous research has not addressed.
Peter has worked on pooling designs but his pooling designs don’t have the overlap, which takes its inspiration from the Samurai Sudoku puzzle. The combination of the pooling and the overlap, and how you can then assess differences, is what is new about the design and the research in our paper.
WSB: Why is this important in marketing?
QL: When you run an experiment, you want to allocate your resources in such a way that you get the most information out of the data you’ve collected. So this design, if you think about the application in marketing, we can see how the idea can be used in effective sampling.
For example, if Walmart wants to learn about the sales performance of a brand, it doesn’t want to track the brand’s performance in every single store worldwide. They have to sample. They could sample the stores in different ways. If they just did a random sample, they might have good luck and the stores are representative. But that might not be the case.
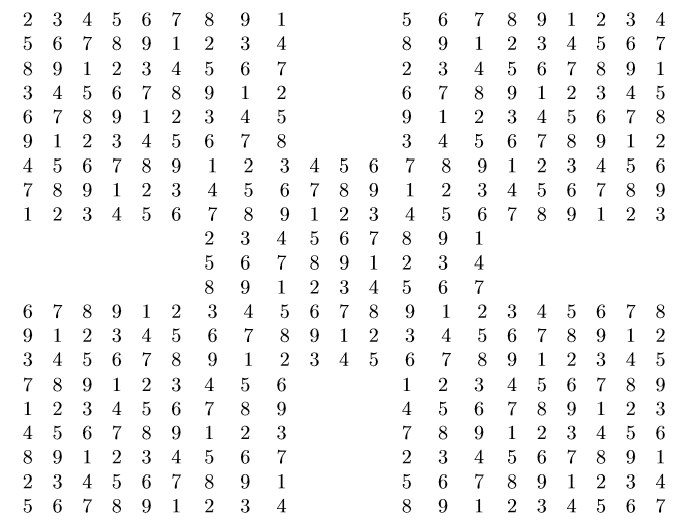
With Walmart, you can think of these samples as different batches or slices, it could be three different locations—Northeast, Central, and West. Within each region, you would sample the stores based on our Samurai Sudoku design. And if there’s any inherent difference between the regions—maybe people in the Northeast react to the brand differently than they do in the Central region—we could catch that.
This system allows retailers to assess any inherent differences and incorporate those insights into promotional strategies. You may decide based on the data that the Central region is quite significantly different from the other regions and allocate your marketing budget differently. You’ll be able to understand where you need to spend extra advertising and promotional dollars. It could support differential spending for advertising across the regions.
WSB: Who is the Sudoku fan?
QL: Peter Qian. We work closely together, and he was the advisor to Xu Xu, the Ph. D student who worked out all the mathematics to construct the designs. During one of his business trips Peter was reading the newspaper and saw the Sudoku game and said, “Can we use this idea for our designs?” So he challenged Xu to see if we could do something like this.
At that time there was no answer, but the student took the challenge and came up with the theory. I contributed mainly to the writing and the applied side.
WSB: Are you teaching this in your class?
QL: I’ve talked about the designs in my class, but I want to introduce this idea in its entirety to my students. Some of my students come from different backgrounds—some from pharmaceutical, some from industrial engineering—and I think they could really put this idea to use.
I talked to a friend who works at a local pharmaceutical company and she said it would be really helpful. She works in a lab and what they do is sometimes different temperature rates could be tested or sometimes they need to manipulate the mix of the different ingredients. She said this could be helpful because what they were doing was trial and error and tweaking it based on intuition. There was no systematic way, but what we could do was provide them a systematic way to test the different combinations. If they could plan this ahead, it would be really cost-effective.
Read the full paper, “Samurai Sudoku-Based Space-Filling Designs for Data Pooling,” in The American Statistician.
Qing Liu is associate professor of marketing at the Wisconsin School of Business.
Tags: